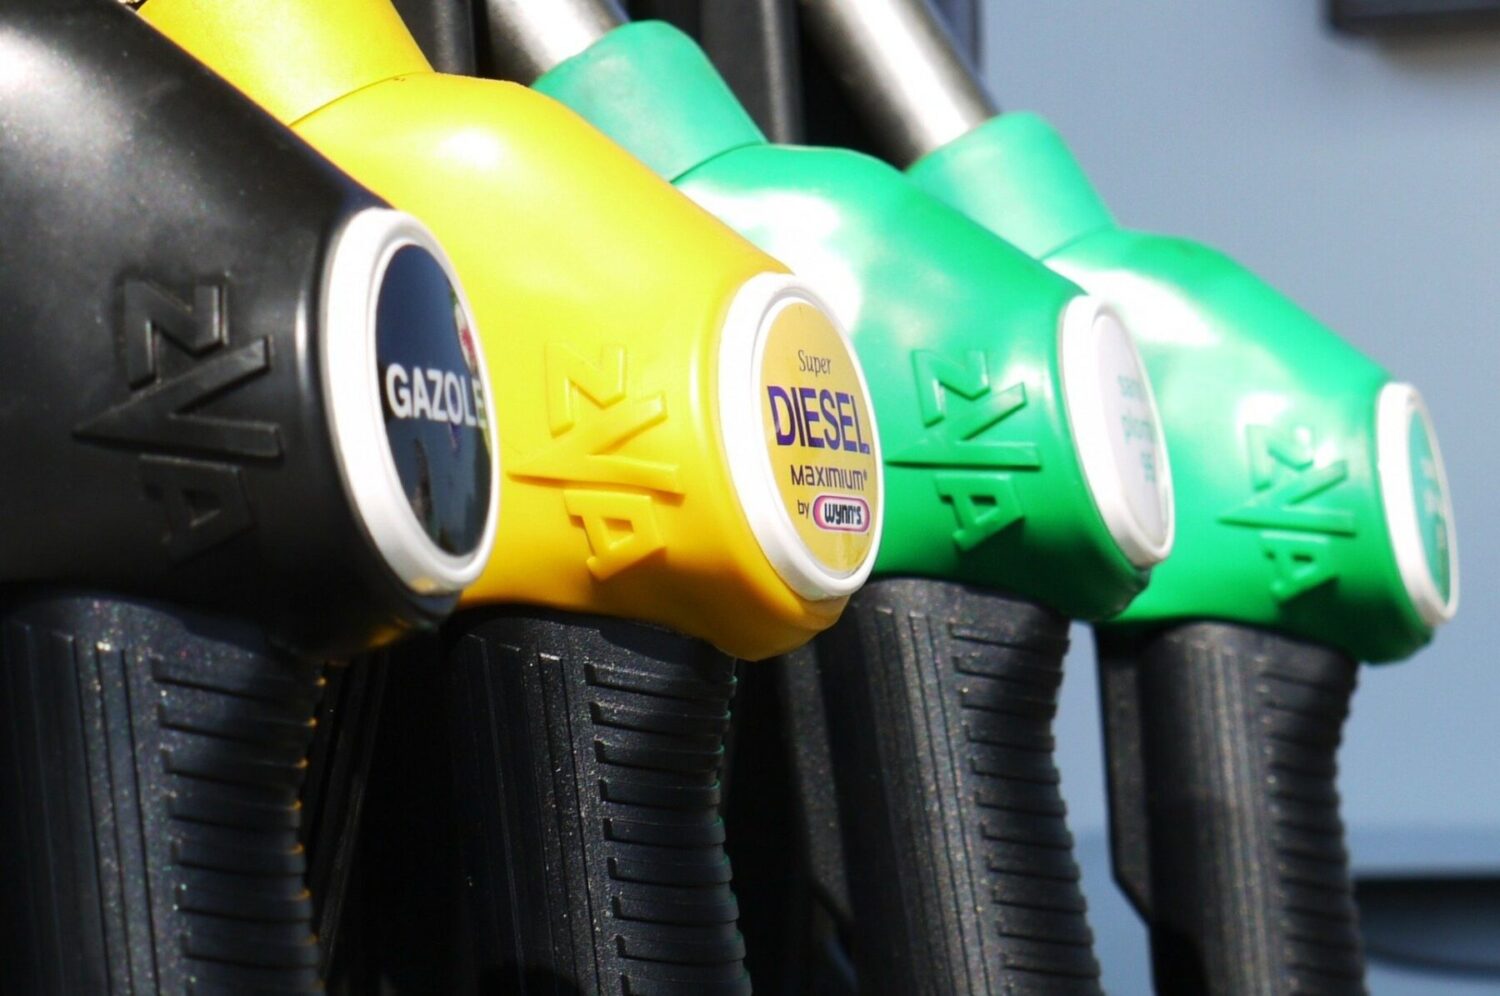
This articles describes the EU green deal. It also compares the EU and Indian pollution control standard based on ambient air quality and permissible pollution from automobiles.
An Article by Shreyash More, Cademix Institute of Technology
Air pollution and its causes
Air pollution is considered as the release of pollutants in air that are harmful to human health and the planet as a whole. According to the World Health Organization (WHO), air pollution is responsible for nearly seven million deaths worldwide each year. Most part of the air pollution comes from the use and production of energy. When fossil fuels are burned, gases and chemicals are released into the air. Air pollution in the form of carbon dioxide and methane increases the temperature of the earth. Fog forms due to increased heat. Climate change is also gradually increasing. The production of allergenic air pollutants includes mold and pollen. Therefore, the EU Green Deal was introduced to reduce all these effects.
What is European Union’s Green deal?

The European Green Deal is a combination of policy initiatives introduced by the European Commission. Its goal is to achieve climate neutrality in Europe by 2050. EU Green deal is not a law, but a collection of ideas which are proposed with goals of reducing pollution.
History of EU Green Deal
After decades of hard work to reduce air pollution, the lobby of environmental groups of developed nations signed first carbon reduction scheme in Japan in the year 1997. This is the Kyoto protocol. The European countries along with USA, Australia, Japan, Russia and Canada fall under the first annex-1. These countries produce most CO2 and had to cut back on carbon emissions. After the introduction of Kyoto protocol, there was 20% drop in air pollution in the period between 2000-2015. This became possible because most of the manufacturing facilities were shifted to developing countries. Pollution throughout the world started to rise again creating a need to find a global solution to this problem.
The countries around the world signed the Paris Climate Agreement after years of negotiations, to keep global temperature rise below 2 degrees Celsius. However, most countries withdrew from the pact because they were unsure about it. Following the United States’ exit in 2019, the European Union pledged to achieve carbon neutrality by 2050. Their target being reducing the greenhouse gas emissions up to 30% by 2030 and up to 55% by 2050 as compared to 1990.
In 2019, European Union’s signed the green deal. Its goal was decarbonizing and digitalization European economy.
Statistics for European Union’s Green deal
There were many reason for the European green deal to take place. The statistical data given in the table below explains the reasons as to why Green deal was important.
| Domains | Statistics |
| Clean energy | More than 75% of greenhouse gas emissions in the EU are due to energy production and consumption. Renewable resources were responsible for 17.5 percent of the EU’s total gross energy consumption in 2017. |
| Sustainable industry | According to studies, the world’s annual resource extraction tripled from 1970 to 2017. The consequences of this procedure resulted in a 90 percent reduction in biodiversity. The existing industry in the European Union is responsible for 20% of its greenhouse gas emissions. Within the European Union’s industry, 12 percent of current resources come from recycling processes. |
| Building & renovations | The European Union’s construction and repair processes utilise 40% of all energy consumed. |
| Farm to fork | 20% of food produced in the European Union is wasted, and 36 million people are unable to eat a nutritious meal every other day. |
| Eliminating pollution | Up to €189 billion is spent on health issues connected to pollution from the EU’s 50,000 industrial sites. |
| Sustainable mobility | Transportation methods account for 25% of greenhouse gas emissions. Road transport accounts for 71.7 percent of the total, with aviation accounting for 13.9 percent, water accounting for 13.4 percent, and railways and other modes accounting for the remaining. |
| Biodiversity | Within the EU, €40 trillion depends on nature and its resources. The population of wild species has declined by over 50% on average in the last two generations. |
These statistics prove to us why implementation of green deal was important. All the new laws passed under green deal take into account its effects on the domains given above in the table.
Comparison between European and Indian air pollution control standards
Based on Ambient Air quality standards
Indian Ambient Air quality standards
The National Ambient Air Quality Standards of India are based on Air pollution and control act which was introduced in 1982. Central Pollution Control Board (CPCB) has the authority to control these standards. Revisions were made in this act in 1994 and in 2009 as well. India follows the norms revised in 2009.
However, Approximately 80% of the urban population is currently exposed to air that does not meet the Central Pollution Control Board’s ambient air quality limit for PM10.
CPCB has discussed several aspects of Air Quality Management (AQM), such as setting pollution reduction objectives, analyzing air quality and source status. Also devising air quality control methods, putting policies in place on the ground, and conducting continuing review. The initial purpose of AQM is to set goals to reduce air pollution levels. The National Clean Air Program (NCAP), which was launched in January 2019, has set a goal of a 20-30% reduction in PM concentration by 2024. The assessment of air quality and source status is the second component of AQM. This component contains a variety of tools, such as emissions inventories, air quality monitoring, and air quality modelling. It allows air quality managers to set emission reduction objectives in order to meet the AQM goal.
EU Ambient Air quality standards
The Thematic Strategy on Air Pollution (TSAP) of 2005 and the National Emission Ceilings Directive (NECD) of 2001 are the EU’s two air quality strategies. The TSAP was designed as part of the 6th Environmental Action Program (6EAP). It defined air quality goals and policy measures. Ambient Air Quality and Cleaner Air for Europe, Directive 2008/50/EC, which is currently followed in Europe is the most significant of them.

EU Air Quality (https://www.transportpolicy.net/standard/eu-air-quality-standards/)
The above graph shows the comparison between ambient air norms between India and EU. From this we can conclude that ambient air pollution control norms are strict in India as compared to EU as the permissible values are low in many pollutants. However, the rate of implementation and follow-up of the norms is very low in India.
Based on Standards for air pollution from automobiles

European Union air pollution control norms
From July 1992, the EU implemented EURO stage regulations to reduce pollution caused by automobiles. The date of each stage’s introduction is listed in the table below. Carbon monoxide (CO), hydrocarbons (HC), hydrocarbon + nitrogen oxides (HC+NOx), nitrogen oxides (NOx), and particulate matter (PM) allowed values, all in gram/km. The particle counts are expressed in numbers per kilometer.
| Stage | Date of introduction | CO | HC | HC+NOx | NOx | PM | PN |
| Petrol | |||||||
| Euro 1 | 1992.07 | 2.72 (3.16) | – | 0.97 (1.13) | – | – | – |
| Euro 2 | 1996.01 | 2.2 | – | 0.5 | – | – | – |
| Euro 3 | 2000.01 | 2.30 | 0.20 | – | 0.15 | – | – |
| Euro 4 | 2005.01 | 1.0 | 0.10 | – | 0.08 | – | – |
| Euro 5 | 2009.09b | 1.0 | 0.10d | – | 0.06 | 0.005e,f | – |
| Euro 6 | 2014.09 | 1.0 | 0.10d | – | 0.06 | 0.005e,f | 6.0×10¹¹ e,g |
| Compression Ignition (Diesel) | |||||||
| Euro 1† | 1992.07 | 2.72 (3.16) | – | 0.97 (1.13) | – | 0.14 (0.18) | – |
| Euro 2, IDI | 1996.01 | 1.0 | – | 0.7 | – | 0.08 | – |
| Euro 2, DI | 1996.01a | 1.0 | – | 0.9 | – | 0.10 | – |
| Euro 3 | 2000.01 | 0.64 | – | 0.56 | 0.50 | 0.05 | – |
| Euro 4 | 2005.01 | 0.50 | – | 0.30 | 0.25 | 0.025 | – |
| Euro 5a | 2009.09b | 0.50 | – | 0.23 | 0.18 | 0.005f | – |
| Euro 5b | 2011.09c | 0.50 | – | 0.23 | 0.18 | 0.005f | 6.0×10¹¹ |
| Euro 6 | 2014.09 | 0.50 | – | 0.17 | 0.08 | 0.005f | 6.0×10¹¹ |
Indian air pollution control norms
India follows Bharat-stage (BS) guidelines to control air pollution caused by passenger vehicles. The table below displays the allowed levels of carbon monoxide (CO), hydrocarbons (HC), hydrocarbon + nitrogen oxides (HC+NOx), nitrogen oxides (NOx), and particulate matter (PM) in gram/km and numbers/km, respectively.
| Stage | Year of introduction | CO | HC | HC+NOx | NOx | PM | PN |
| Petrol Vehicles | |||||||
| 1991 | 14.3 | 2.0 | – | – | – | ||
| 1996 | 8.68 | – | 3.00 | – | – | ||
| 1998 | 4.34 | – | 1.50 | – | – | ||
| India 2000 | 2000 | 2.72 | – | 0.97 | – | – | |
| BS II | 2005.04 | 2.2 | – | 0.5 | – | – | |
| BS III | 2010.04 | 2.3 | 0.20 | – | 0.15 | – | |
| BS IV | 2017.04 | 1.0 | 0.10 | – | 0.08 | – | |
| BS VI | 2020.04 | 1.0 | 0.10a | – | 0.06 | 0.0045b | 6.0×10¹¹b |
| Diesel Vehicles | |||||||
| 1992 | 17.3 | 2.7 | – | – | – | ||
| 1996 | 5.0 | – | 2.0 | – | – | ||
| India 2000 | 2000 | 2.72 | – | 0.97 | – | 0.14 | |
| BS II | 2005.04 | 1.0 | – | 0.7 | – | 0.08 | |
| BS III | 2010.04 | 0.64 | – | 0.56 | 0.50 | 0.05 | |
| BS IV | 2017.04 | 0.50 | – | 0.30 | 0.25 | 0.025 | |
| BS VI | 2020.04 | 0.50 | – | 0.17 | 0.080 | 0.0045 | 6.0×10¹¹ |
Based on the EURO norms and Bharat-Stage norms in the tables above, it is clear that the allowed values for emissions in both the norms were different initially. Maximum permissible values of pollution were same with the introduction of EURO-2 and Bharat Stage-2. Also, when it comes to implementation of norms, India lags behind as compared to Europe.
Expertise required in Job Market
According to a recent international Labour Office Report, The major part of the skill shortage and the related gaps are related to the mismatch between the new regulations and the existing course curricula in the universities. The industry most recommendations are likely to follow from the analysis of skills gaps. These will come from existing and anticipated shortages in the quantity of skills available and emerging qualitative gaps in the supply of skills. The job seekers and the industry are advised to join extracurricular activities and tech acceleration programs to bridge the skills gap required in the industry. This includes project based and short mini-internships supervised by highly professional mentors in the field.
Conclusion: Europe is 6 Years ahead
As a summary, from this article we can conclude that ambient air pollution control norms and timing of introduction are the major difference between Europe and India. In India, the permissible pollution values are low compared to Europe. In India, the target time to implement the norms is much slower compared to Europe. The targets such as Euro 6 which already implemented in Europe in 2014, was introduced in India in 2020. Hence, we can say EU is 6 year ahead of India in this respect.
Related Keywords:
Greenhouse gases, Coal, Clean-air, Global-warming, Environmental-protection, Ozone, Sulphur, Combustion, Pollutant, Environmental protection, Gasoline, Ambient air, Atmospheric, Asthma, Sulphur-dioxide, Hazardous, Polluted, Mitigation, Effects of air pollution, Natural gas, Nitrogen oxides, Health risks, Acid Rain, Carbon-monoxide.

