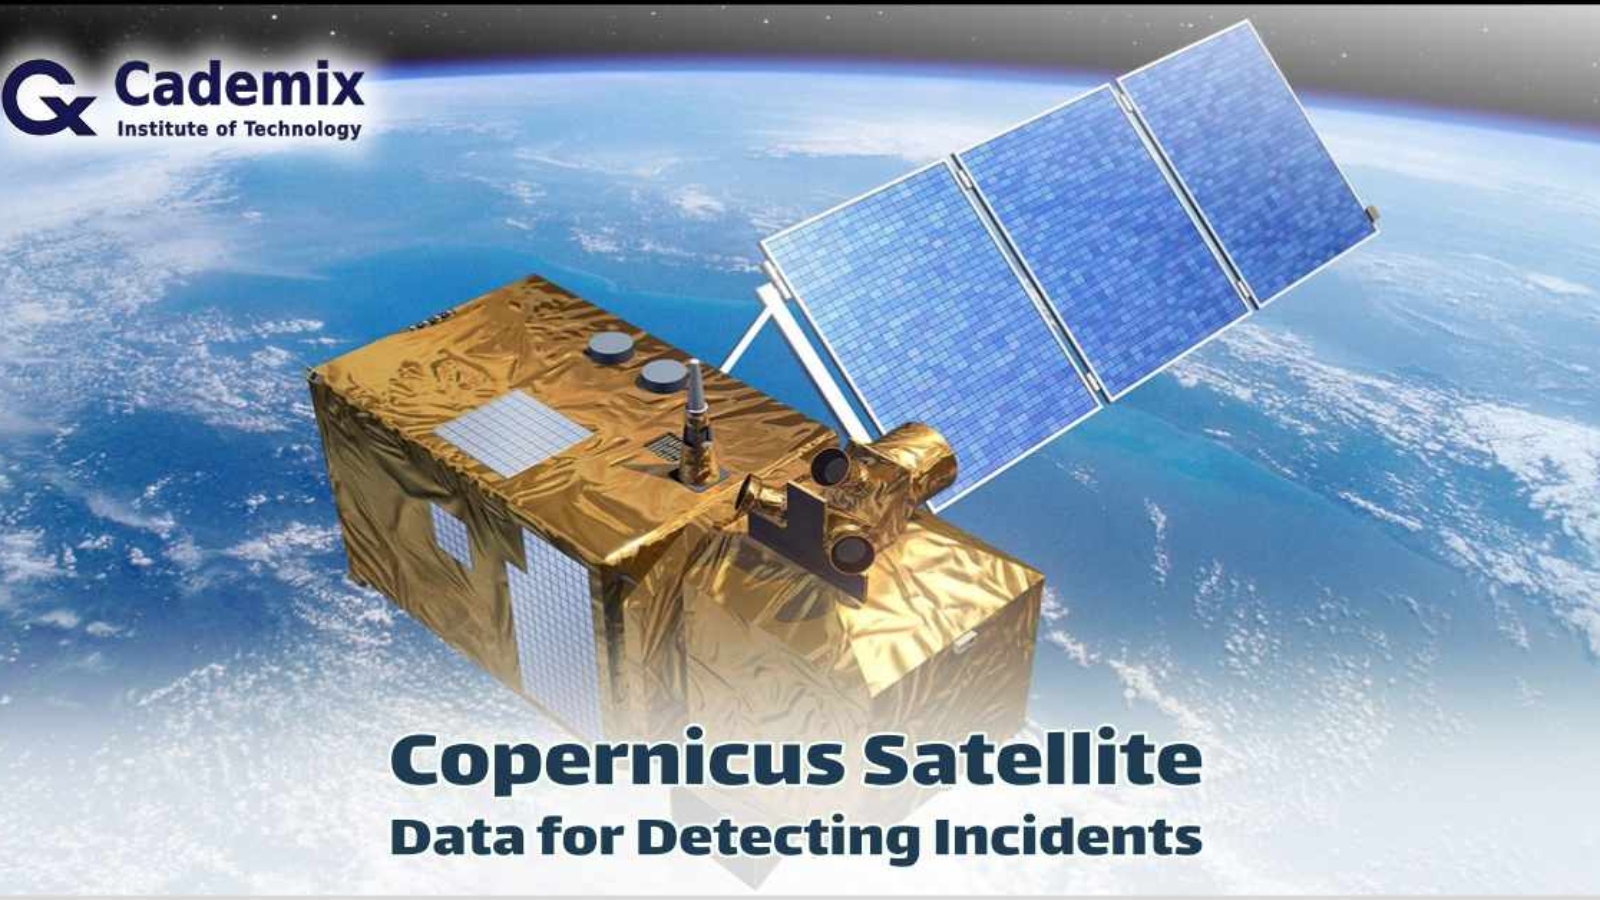
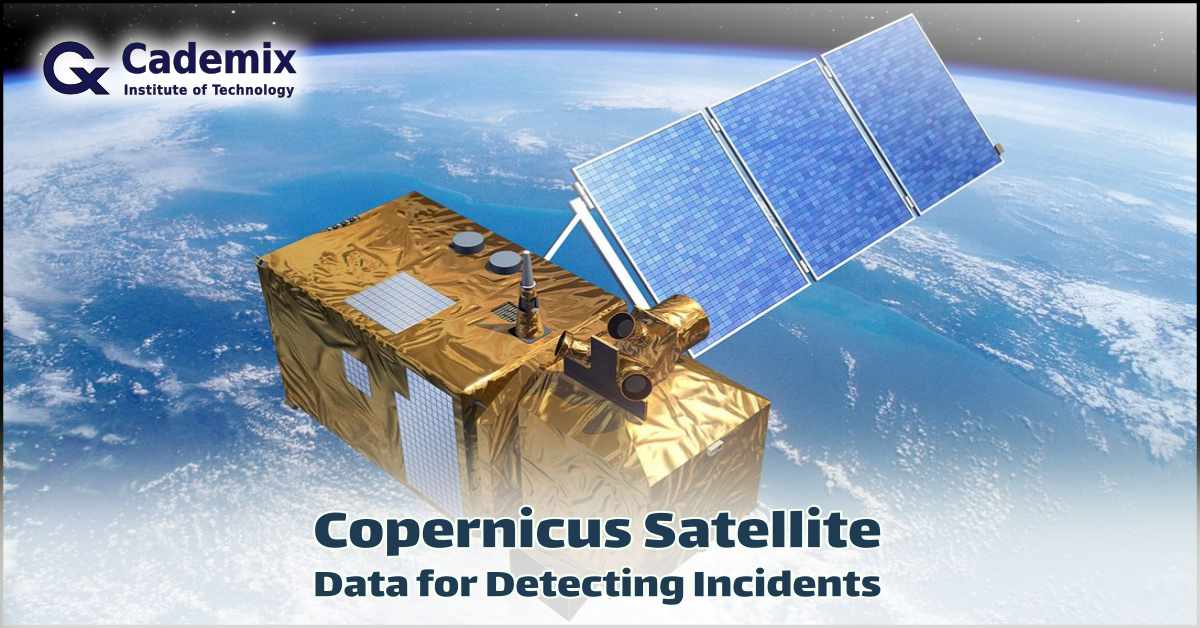
Satellite imagery can provide valuable information in various situations, including detecting incidents like helicopter crashes. This tutorial will guide you through using Copernicus satellite data to analyze and detect such events. While some steps can be done manually, others, like large-scale image comparison, require systematic and automated methods using programming.
Cademix Institute of Technology-Dr. Javad Zarbakhsh
Keywords: Copernicus satellite data, Sentinel-1, Sentinel-2, helicopter crash detection, Earth observation, SNAP software, QGIS analysis, satellite imagery preprocessing, incident detection, automated change detection
Table of Contents
What is Copernicus?
Copernicus is the European Union’s Earth observation program, offering satellite data for free to monitor the environment and manage natural disasters.
What You Will Need:
- A computer with internet access.
- A registered account on the Copernicus Open Access Hub.
- Basic knowledge of handling computer files and using web applications.
- Optional: A mentor or professor with experience in satellite data analysis.
Procedure for Detecting Incidents Using Copernicus Satellite Data
Detecting incidents like a helicopter crash using Copernicus satellite data is a multifaceted process that involves accessing, preprocessing, and analyzing satellite imagery. This extensive procedure can reveal critical changes on the ground when images from different dates are compared. The Copernicus Open Access Hub is a crucial resource, offering free access to data from the Sentinel satellites, which are designed for detailed Earth observation. Registering for an account and logging into the hub is the first step. Once logged in, users can explore available data by selecting the “Explore Data” option.
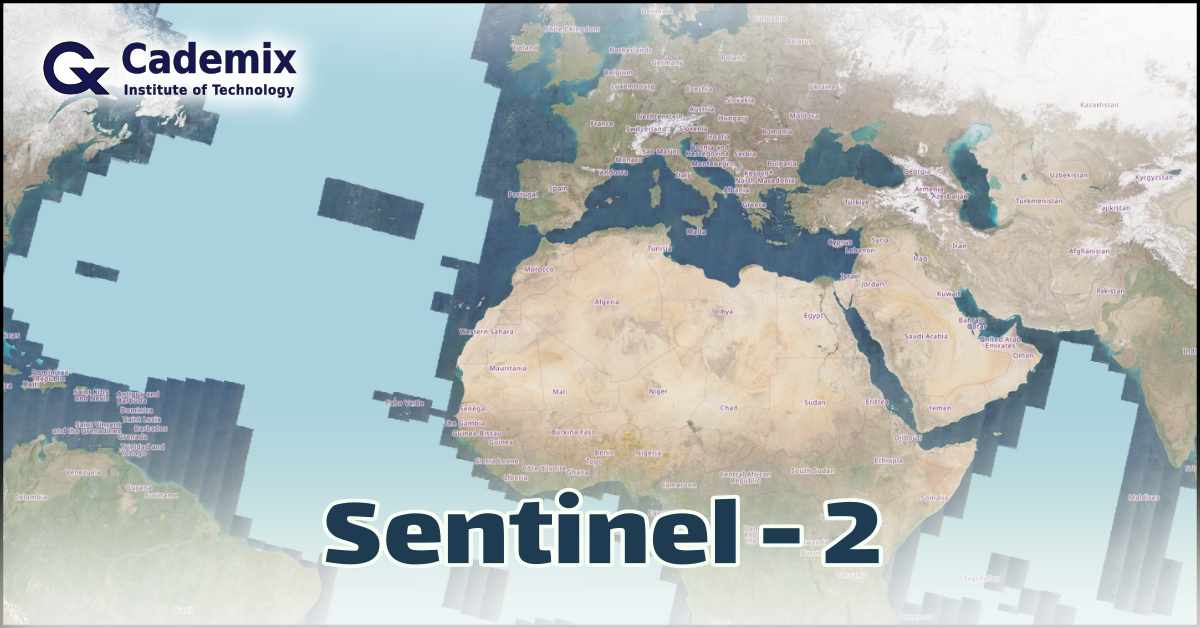
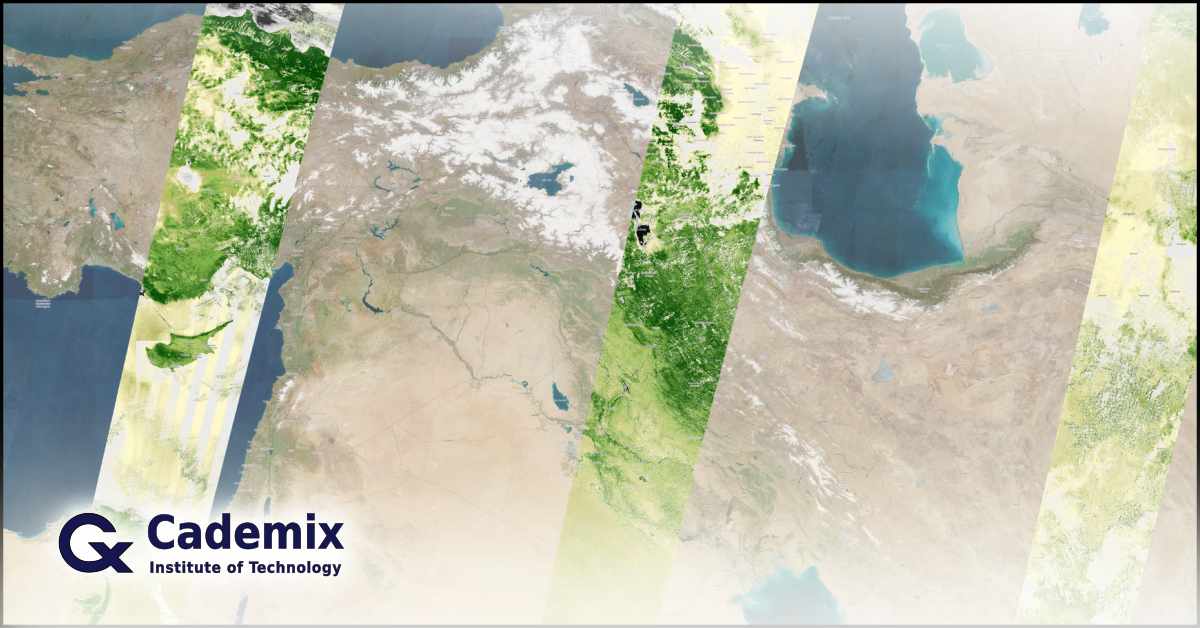
The interactive map feature allows users to pinpoint the exact area of interest where the incident is suspected to have occurred. Setting a precise date range, ideally within the last 24-48 hours, ensures that the most recent images are retrieved. Selecting the appropriate satellite data is critical: Sentinel-1 provides radar images that are useful in all weather conditions and at night, while Sentinel-2 offers high-resolution optical images that are ideal for detecting visible changes in the landscape.
After selecting and downloading the relevant data, preprocessing is essential to prepare the images for accurate analysis. This step involves using the Sentinel Application Platform (SNAP), a free software tool provided by the European Space Agency (ESA) for processing Sentinel data. Once SNAP is installed, the downloaded Sentinel data can be opened and preprocessed. For Sentinel-2 data, atmospheric correction using the Sen2Cor tool is necessary to remove atmospheric distortions and improve image clarity. Additionally, resampling the data helps to ensure consistent resolution and alignment, which is vital for accurate comparisons.
For Sentinel-1 data, calibration corrects sensor-specific biases, while speckle filtering reduces noise, enhancing the clarity of the radar images. Terrain correction further refines the images by accounting for topographic variations, making the data more reliable for analysis.
Visual analysis of the preprocessed images involves comparing images from different dates to identify changes that might indicate an incident. This manual process includes loading images side-by-side and looking for signs such as burn marks, debris, or disturbed terrain that could suggest a crash. Automated change detection techniques in SNAP can streamline this process by aligning images from different dates and using algorithms to highlight significant differences. Integrating weather information is also crucial, as cloudy conditions can obscure optical images, making it difficult to detect changes on the ground. In such cases, radar images from Sentinel-1 are particularly valuable as they can penetrate clouds and provide clear images regardless of weather conditions.
Large-scale comparisons and detailed analysis often require more systematic and automated methods using programming. Tools like Python can be employed to handle large datasets, perform automated change detection, and generate comprehensive reports. This approach involves writing scripts to automate the comparison process, identify anomalies, and highlight areas of interest.
Given the complexity of these tasks, individuals lacking advanced technical skills are encouraged to seek assistance from mentors or professors with expertise in satellite data analysis. Their guidance can ensure accurate interpretation of the data and help in making informed conclusions about the incident. By following these detailed steps and utilizing both manual and automated methods, Copernicus satellite data can be effectively used to detect and analyze incidents such as helicopter crashes, providing valuable insights for emergency response and investigation.
Step 1: Register and Log In
Register on the Copernicus Open Access Hub
- Visit the Copernicus Open Access Hub:
Go to https://scihub.copernicus.eu/. - Register for an Account:
- Click on “Register” and fill in the required details.
- Check your email for the activation link and complete the registration process.
Log In to Your Account
- Log In:
- Return to the Open Access Hub and log in with your new credentials.
Step 2: Explore Copernicus Satellite Data
Choose “Explore Data”
- Select “Explore Data”:
- After logging in, click on “Explore Data”. This option allows you to search and view available satellite data.
Step 3: Select the Area of Interest (AOI)
Navigate to the Map Interface
- Find the Region of Interest:
- Use the interactive map to locate the region where you suspect the incident occurred.
- Draw AOI:
- Draw a rectangle or polygon around the area of interest by clicking on the map and dragging to create the shape.
Step 4: Set Time Range and Select Satellite
Specify the Time Range
- Set the Time Range:
- Specify the date range to include the last 24-48 hours. This ensures you get recent images.
Choose the Appropriate Satellite
- Select the Satellite:
- Sentinel-1: Choose this for radar images, useful in all weather conditions and at night.
- Sentinel-2: Choose this for high-resolution optical images, which are better for visible changes in the landscape.
Step 5: Filter Copernicus Satellite Data
Apply Filters
- Use Filters:
- Platform Name: Choose either Sentinel-1 or Sentinel-2.
- Product Type: For Sentinel-1, select GRD (Ground Range Detected). For Sentinel-2, select Level-1C.
- Cloud Cover: For Sentinel-2, set a low percentage to get clear images.
Step 6: Download Data
Browse Search Results
- Select Relevant Datasets:
- Look through the list of available images and select the ones that cover your AOI and time range.
Download Images
- Download Data:
- Click the download icon next to the images you want to save them to your computer.
Step 7: Install and Use SNAP (Sentinel Application Platform)
Download and Install SNAP
- Download SNAP:
- Go to http://step.esa.int/main/download/ and download SNAP.
- Install SNAP:
- Follow the installation instructions for your operating system.
Open Data in SNAP
- Launch SNAP:
- Open SNAP and load the downloaded Sentinel data files.
Preprocess the Copernicus Satellite Datain SNAP
- Preprocess Sentinel-2 Data:
- Apply atmospheric correction using the Sen2Cor tool.
- Resample the data if necessary.
- Preprocess Sentinel-1 Data:
- Apply calibration, speckle filtering, and terrain correction using SNAP’s built-in tools.
Step 8: Visual Analysis
Compare Images
- Manual Comparison:
- Load images from different dates and compare them side-by-side.
- Look for visual changes such as burn marks, debris, or disturbed terrain that might indicate a crash.
Perform Change Detection
- Automated Change Detection:
- Align images from different dates for accurate comparison using the “Coregistration” tool in SNAP.
- Use change detection tools in SNAP to identify significant differences between the images.
Step 9: Use QGIS for Additional Analysis
Download and Install QGIS
- Download QGIS:
- Go to https://qgis.org/ and download QGIS.
- Install QGIS:
- Follow the installation instructions for your operating system.
Load Copernicus Satellite Datainto QGIS
- Open QGIS:
- Open QGIS and load the Sentinel images by using “Add Raster Layer”.
Visual Comparison in QGIS
- Compare Images:
- Compare images from different dates using the “Tile” view.
- Use plugins like “SCP (Semi-Automatic Classification Plugin)” for advanced analysis.
Motivation and Challenges
Importance of Incident Detection
- Understanding the Context:
- Detecting incidents such as a helicopter crash involving high-profile individuals, like the Iranian president, is crucial for emergency response and investigation.
Challenges
- Weather Conditions:
- Cloudy weather can obscure optical images, making it difficult to detect changes on the ground. Radar images from Sentinel-1 are helpful in such conditions.
Step 10: Getting Help on Copernicus Satellite Data
Seek Assistance
- Finding a Mentor:
- If you lack experience in satellite data analysis, consider reaching out to a mentor or professor who specializes in this field. They can provide guidance and support.
- If you need to learn this for a professional and career reason, and need an official certification, please feel free to get in touch. Cademix Acceleration Program is always open for accepting new applications.
Conclusion
By following these steps, you can effectively use Copernicus satellite data to detect incidents such as a helicopter crash. This guide provides a comprehensive approach from accessing the data to analyzing it using powerful tools like SNAP and QGIS. For large-scale comparisons, automated methods using programming are recommended. Don’t hesitate to seek expert assistance if needed.